Key Takeaways
- The true annual cost of car commuting is $10,780–$13,400 when you include the $297/month payment, $167/month insurance, $150/month gas, $100–$300/month parking, and $75/month maintenance — versus $1,560/year for a transit pass or $420/year for a bike.
- American commuters spend an average of 239 hours/year (nearly 10 full days) in their car. Transit riders average 310 hours but can read, work, or sleep — recovering 50–70% of that time for productive use.
- E-bikes have cut the average bike commute distance barrier from 5 miles to 15 miles, with operating costs of $0.02/mile versus $0.67/mile for cars — making cycling viable for 62% of U.S. commutes that are under 10 miles each way.
- Switching from car commuting to transit or cycling frees up $8,000–$12,000/year — enough to max a Roth IRA ($7,000), build a 6-month emergency fund in under 2 years, or pay off $12,000 in credit card debt annually.
Table of Contents
- The True Cost of Driving to Work
- Public Transit Economics: What a Monthly Pass Actually Buys You
- The Bike Commute: $420/Year and the E-Bike Revolution
- Full Cost Comparison: Car vs. Transit vs. Bike
- The Time Equation: Hours Lost, Hours Recovered
- The Hybrid Commute: Combining Modes for Maximum Savings
- What to Do With $10,000/Year in Commute Savings
- Frequently Asked Questions
The True Cost of Driving to Work
Most car commuters know roughly what they spend on gas. Almost none know the actual total. When you add up every expense — the number is startling. The average American car commuter spends between $10,780 and $13,400 per year just getting to and from work, according to Bureau of Labor Statistics consumer expenditure data and AAA’s annual driving cost estimates.
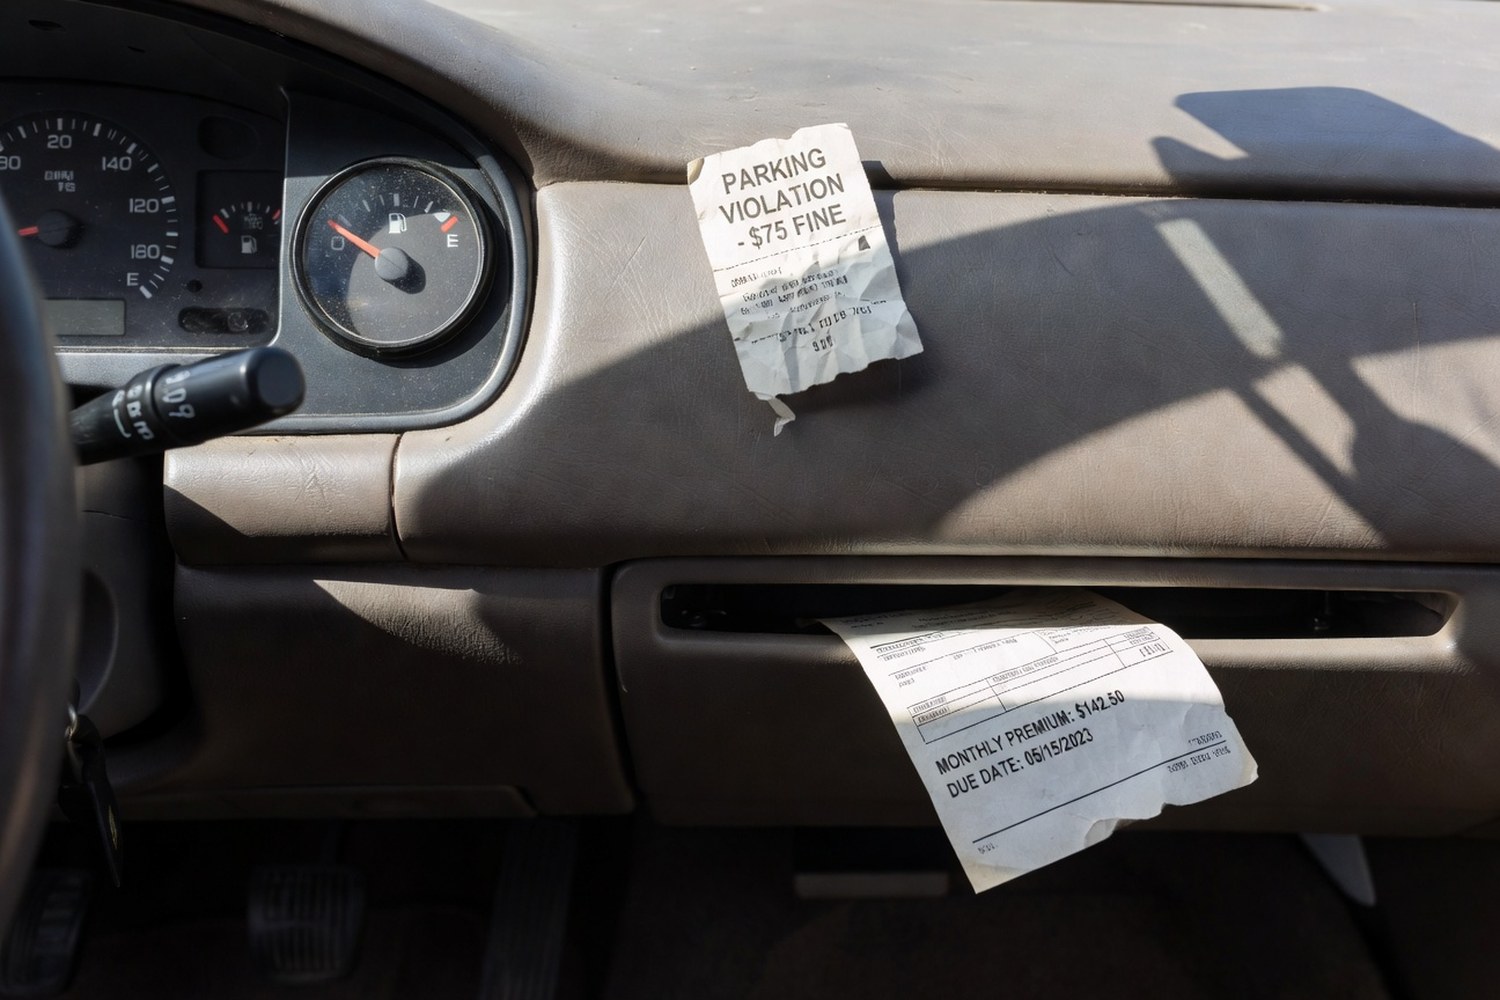
Here’s how it breaks down: car payment averaging $297/month (used car, 60-month term at 7%). Insurance averaging $167/month. Gasoline at $150/month for a 25-mile round-trip commute. Parking — and this is the one that shocks people — averaging $100–$300/month in metro areas ($225/month median in the top 20 cities). Maintenance and tires at $75/month amortized. Registration, inspection, and tolls at another $50/month. Add depreciation — the invisible cost — at $200–$350/month for the average sedan, and you’re looking at $1,039 to $1,289 every single month leaving your bank account because of a car.
And that’s before unexpected repairs. A single transmission issue runs $3,000–$5,000. An accident deductible is $500–$1,000. These events happen — AAA data shows the average driver faces $1,200/year in unplanned repair costs. The car isn’t just transportation; it’s a money furnace. Understanding what auto insurance actually covers helps you at least optimize one piece of this equation.
Public Transit Economics: What a Monthly Pass Actually Buys You
A monthly transit pass in the 20 largest U.S. metro areas costs $70–$130, with a national average of $130/month or $1,560/year. Compare that to $10,780–$13,400 for car commuting. The savings: $9,220 to $11,840 per year. That’s not a rounding error — that’s a vacation, a Roth IRA contribution, or 18 months of aggressive credit card payoff.
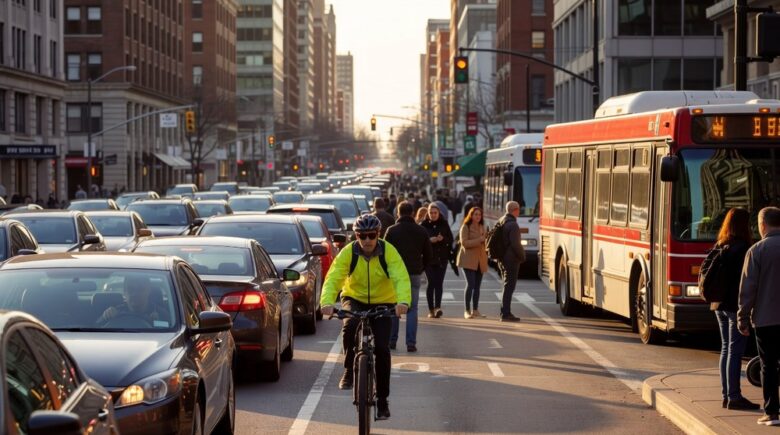
The Federal Transit Administration reports that 45% of Americans live within a quarter-mile of a transit stop, but only 5% regularly commute by transit. The gap isn’t access — it’s perception. Most people assume transit is slower, less comfortable, and less reliable than driving. And sometimes it is. But in the 15 most congested metro areas, transit commuters arrive within 10 minutes of car commuters during peak hours — and they arrive having read a book, caught up on emails, or taken a nap instead of white-knuckling through traffic.
There’s also the tax angle. Employer-provided transit benefits allow up to $315/month (2026) in pre-tax transit spending through commuter benefit programs. On a $130/month pass, that saves $390–$520 in annual taxes depending on your bracket. Ask your HR department — about 40% of large employers offer this but only 15% of eligible employees use it. Our seasonal commute planning guide covers how to adapt transit use for weather changes.
| Commute Mode | Monthly Cost | Annual Cost | Cost Per Mile | Avg Commute Time (10mi) | Productive Time? |
|---|---|---|---|---|---|
| Car (owned) | $898–$1,117 | $10,780–$13,400 | $0.67 | 30–55 min | No |
| Public Transit | $130 | $1,560 | $0.12 | 35–65 min | Yes (50–70%) |
| Bicycle | $35 | $420 | $0.05 | 35–50 min | No (but exercise) |
| E-Bike | $45 | $540 | $0.02 | 20–35 min | No (but exercise) |
Monthly commute cost comparison for a 10-mile one-way commute. Sources: BLS, AAA, FTA. Rates as of March 2026.
⚡ Pro Tip
Ask your employer about commuter benefits before buying a transit pass out-of-pocket. Section 132(f) of the tax code allows employers to provide up to $315/month in pre-tax transit and vanpool benefits. If your employer offers this through a program like WageWorks or Edenred, a $130/month transit pass effectively costs $91–$104 after tax savings (depending on bracket). That’s $1,092–$1,248/year — an 87% savings versus driving. About 40% of large employers offer this benefit.
The Bike Commute: $420/Year and the E-Bike Revolution
A quality commuter bicycle costs $400–$800 upfront and lasts 5–10 years. Annual maintenance (tubes, brake pads, chain, annual tune-up) runs $150–$250. Total annual cost: about $420. That’s $35/month — less than most people spend on coffee. The Bureau of Labor Statistics pegs the average car commuter’s daily cost at $44. A bicycle commuter’s daily cost? $1.15.
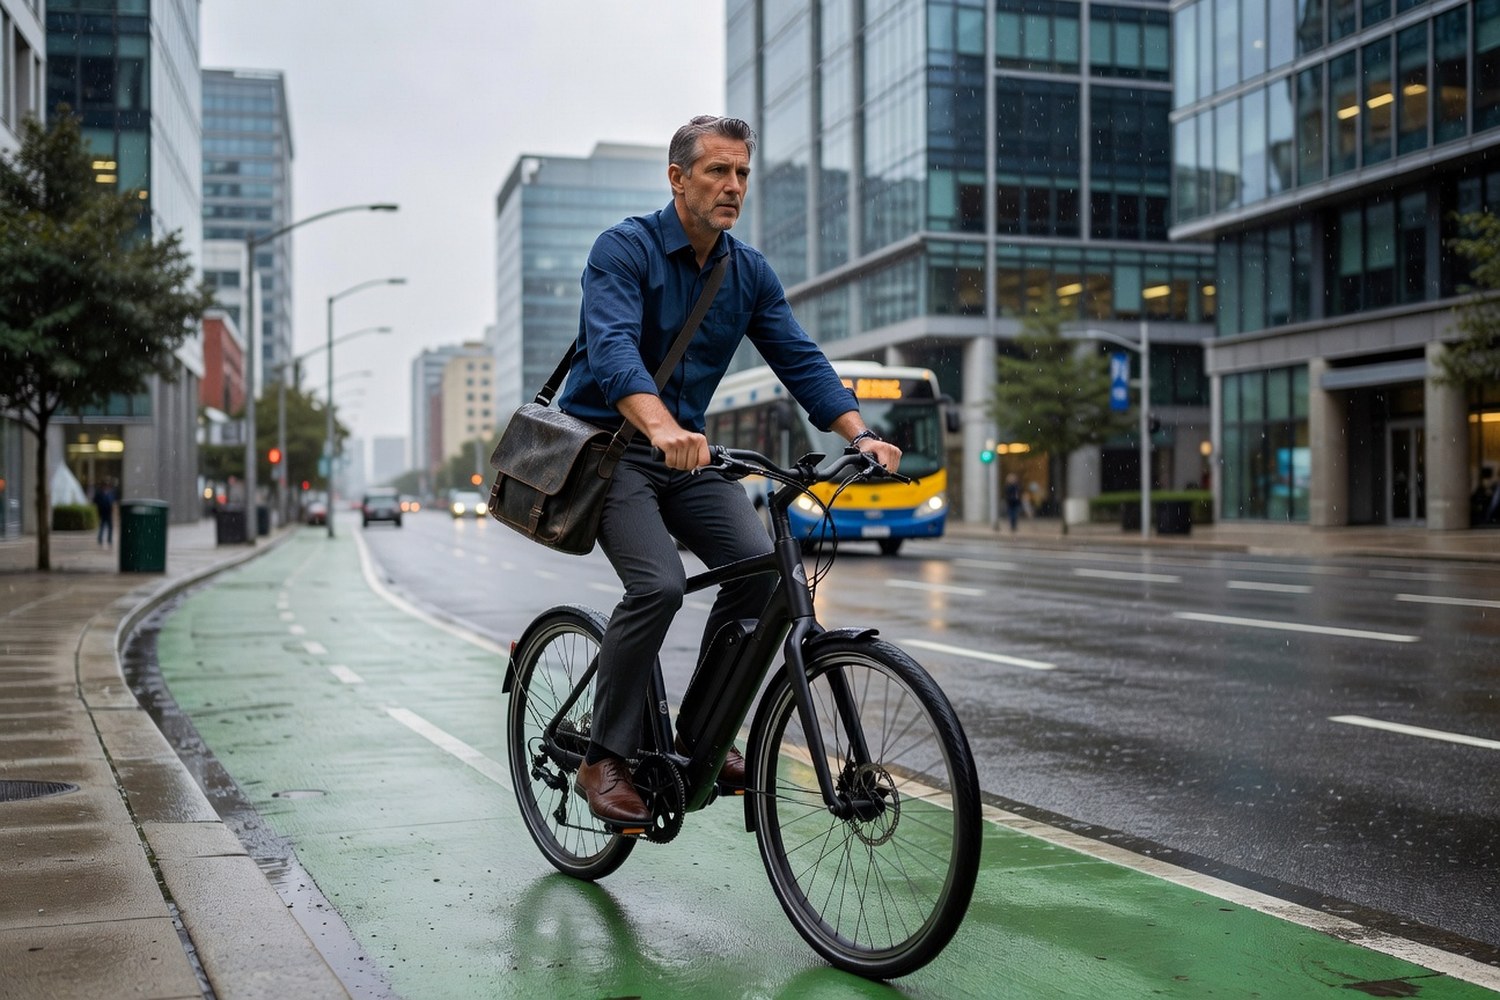
The historical barrier to bike commuting was distance. Beyond 5 miles each way, most people won’t sustain a regular bike commute — you arrive sweaty, it takes too long, and weather becomes a deal-breaker. E-bikes have demolished that barrier. A pedal-assist e-bike covers 15 miles in 45 minutes with minimal sweat, handles hills without effort, and operates at $0.02/mile in electricity. The upfront cost ($1,200–$3,000 for a quality commuter e-bike) pays for itself in 3–5 months versus car commuting.
And here’s a number most people don’t think about: 62% of all U.S. commutes are under 10 miles each way, according to Census Bureau data. That’s well within comfortable e-bike range. If even a quarter of those commuters switched, the collective savings would be roughly $48 billion annually in reduced driving costs — and that doesn’t count the health benefits. Regular bike commuters have 52% lower cardiovascular disease risk and use $1,200/year less in healthcare, per a CDC physical activity research meta-analysis.
Full Cost Comparison: Car vs. Transit vs. Bike
Let me put the 10-year numbers on the table, because that’s the timeframe where the differences become staggering.
Car (10 years): $107,800–$134,000 in total commute costs. You own a depreciating asset worth roughly $3,000 at the end. Net: -$104,800 to -$131,000 in pure transportation expense.
Transit (10 years): $15,600 total. You invested the $9,000/year savings into an index fund earning 7%. That portfolio is worth roughly $125,000 after 10 years. Net: +$109,400 ahead of the car commuter.
Bike/E-bike (10 years): $4,200–$7,000 total (including e-bike replacement at year 5). The $10,000/year savings invested at 7% grows to roughly $138,000. Net: +$131,000 ahead of the car commuter. Plus measurably better health outcomes.
These are not theoretical numbers. The Federal Reserve’s Survey of Consumer Finances shows that households without car loans accumulate net worth 2.3x faster than car-dependent households at the same income level. The car isn’t just expensive — it’s an anchor on wealth building. Understanding what you’d pay for an auto loan makes this comparison even starker.
The Time Equation: Hours Lost, Hours Recovered
The average American car commuter spends 239 hours/year driving to and from work — nearly 10 full 24-hour days. And those hours are lost — you can’t read, work, learn, or rest while driving in traffic.
Transit commuters average 310 hours/year (higher due to walking to stops and potential transfers). But here’s the critical difference: 50–70% of transit time is recoverable. You can read, respond to emails, listen to audiobooks, take an online course, or simply decompress. At a conservative value of $20/hour for productive time recovered, transit commuters recapture $3,100–$4,340/year in usable time. That flips the time comparison entirely — transit isn’t slower when you count productive hours.
Bike commuters have the fastest per-mile speed in congested urban areas (city cycling averages 12–15 mph versus 8–12 mph for cars in peak traffic). A 5-mile bike commute takes 25 minutes; the same distance in rush-hour traffic takes 30–45 minutes. And the bike commute doubles as exercise — eliminating the need for $50–$100/month gym membership. Your commute becomes your workout, your transportation, and your mental health break simultaneously.
| Factor | Car | Public Transit | Bike / E-Bike |
|---|---|---|---|
| Annual hours commuting | 239 | 310 | 200 |
| Productive hours recoverable | 0 | 155–217 | 0 (but = exercise) |
| 10-year total cost | $107,800–$134,000 | $15,600 | $4,200–$7,000 |
| Invested savings at 7% (10yr) | $0 (baseline) | ~$125,000 | ~$138,000 |
10-year commute cost and time comparison for 10-mile one-way commute. Sources: BLS, AAA, FTA, Census Bureau. Verified March 2026.
The Hybrid Commute: Combining Modes for Maximum Savings
You don’t have to go all-or-nothing. The smartest commuters combine modes to capture the best of each:
Bike-to-transit. Ride your bike 2 miles to a train station, take transit 8 miles, walk the last half-mile to the office. Total transit time: competitive with driving. Cost: $1,560/year transit + $200/year bike maintenance = $1,760/year — an 84% reduction from car commuting. Most transit agencies allow bikes on trains during off-peak hours, and many stations have secure bike lockers for $50–$100/year.
Drive 3 days, bike 2 days. If your commute is 8–15 miles, bike on nice-weather days and drive when it rains or when you need to haul gear. Two bike days per week cuts your driving costs by 40% ($4,300/year saved) while keeping the car available when you need it. The health benefits from 2 days of cycling are still substantial — CDC guidelines recommend 150 minutes/week of moderate activity, and two 40-minute bike commutes (each way) covers it entirely.
Carpool + transit. Driving 2–3 days with a carpool partner and taking transit 2–3 days splits your car costs in half while maintaining flexibility. Apps like Waze Carpool and Scoop match commuters with similar routes. A 50% reduction in driving days saves $5,000–$6,500/year. Understanding car market trends also helps you decide whether keeping your car makes financial sense.
⚡ Pro Tip
If you switch from car commuting to transit or cycling, don’t sell your car immediately — reduce insurance to “storage” or “pleasure use only” (non-commute) first. This drops your premium by 25–40% ($500–$800/year savings) while you test whether car-free commuting works long-term. After 3–6 months, if you haven’t needed the car more than twice a month, sell it and pocket the $3,000–$8,000 in remaining value. The insurance optimization guide shows how to adjust your coverage correctly.
What to Do With $10,000/Year in Commute Savings
The savings from ditching a car commute are large enough to materially change your financial trajectory. Here’s what $10,000/year — the midpoint savings from switching to transit or cycling — can do:
Max your Roth IRA. The 2026 contribution limit is $7,000. At 7% average returns over 25 years, that single annual contribution grows to $406,000 in tax-free retirement wealth. Your commute decision literally funds your retirement.
Pay off $10,000 in credit card debt annually. The average household carries $6,580 in revolving credit card debt at 22.8% APR. The commute savings wipe that out in 8 months — freeing up an additional $1,500/year in interest you’ll never pay again. Paying credit cards early accelerates this even further.
Build a 6-month emergency fund in 2 years. The recommended emergency fund is 3–6 months of expenses ($15,000–$30,000 for most households). At $10,000/year in redirected commute savings, you hit 6 months in under 3 years — starting from zero.
Save for a house down payment. $10,000/year for 5 years (invested at 5% in a HYSA) grows to $55,256 — a 10% down payment on a $550,000 home. The commute change didn’t just save money; it bought you a house. Financial freedom often starts with one decision that compounds over time.
Frequently Asked Questions
How much does the average car commuter spend per year?
Between $10,780 and $13,400 annually when all costs are included: car payment ($297/month average), insurance ($167), gas ($150), parking ($100–$300), maintenance ($75), registration/tolls ($50), and depreciation ($200–$350). Most commuters significantly underestimate their costs because they only track gas and payments, missing parking and depreciation.
Is public transit actually cheaper than driving?
Yes — dramatically. The average transit pass costs $1,560 per year versus $10,780 to $13,400 for car commuting. That’s a savings of $9,220 to $11,840 annually. Even after accounting for occasional ride-share or car rental needs ($1,000 to $2,000 per year), transit commuters save $7,000 to $10,000 per year compared to car owners.
How far can you realistically commute by bike?
On a regular bicycle, 5 miles each way is the practical limit for most commuters. E-bikes extend that to 15 miles comfortably, covering the distance in 45 minutes or less with minimal sweat. Census data shows 62% of U.S. commutes are under 10 miles each way — well within e-bike range. An e-bike costs $1,200 to $3,000 and pays for itself in 3 to 5 months versus car commuting.
Can I save money by driving less but keeping my car?
Yes. Switching your insurance from commuter to pleasure-use-only drops premiums 25 to 40% ($500 to $800 per year). Driving 2 days per week instead of 5 cuts gas, parking, and maintenance by 60%. A hybrid approach of bike or transit 3 days plus driving 2 days saves $5,000 to $6,500 annually while keeping the car available for errands and weekends.
What’s the best e-bike for commuting?
Look for a Class 1 or Class 3 pedal-assist e-bike with at least a 500Wh battery (40 to 60 mile range), integrated lights, fender mounts, and a rear rack for a bag. Budget $1,500 to $2,500 for a reliable commuter model. Operating cost is approximately $0.02 per mile in electricity. Factor in a quality U-lock ($60 to $100) and annual maintenance of $150 to $250 for brakes, tires, and chain.
References
- Bureau of Labor Statistics, 2026, “Consumer Expenditure Survey — Transportation,” bls.gov
- Federal Transit Administration, 2026, “National Transit Database,” transit.dot.gov
- Centers for Disease Control, 2026, “Physical Activity and Health Benefits,” cdc.gov
- U.S. Census Bureau, 2026, “Commuting Characteristics — American Community Survey,” census.gov
- Federal Reserve Board, 2026, “Survey of Consumer Finances — Transportation Costs and Wealth,” federalreserve.gov
- Internal Revenue Service, 2026, “Commuter Tax Benefits — Section 132(f),” irs.gov
- Federal Highway Administration, 2026, “National Household Travel Survey,” fhwa.dot.gov
- Consumer Financial Protection Bureau, 2026, “Auto Loan Cost Resources,” consumerfinance.gov
- Department of Energy, 2026, “E-Bike and Alternative Transportation Efficiency Data,” energy.gov
- Environmental Protection Agency, 2026, “Fuel Economy and Commute Cost Calculator,” fueleconomy.gov
Keep Reading
More on transportation costs and smart spending: